
ETS Cube Power BI User Guide
Please follow the instructions below to access endowment data via ETS Cube Power BI. If you do not see your normal reports or have any problems, please contact Monnazah Sohail Rashid at mrashid gwu [dot] edu (subject: Analytics) (mrashid[at]gwu[dot]edu) or 571-553-0033.
Chapter 3: General Information
1. Log In
a. To access the ETS Cube Power BI, you must first be on the GW network. If you are physically at a GW location, you should be able to reach the launch page without using VPN. If you are at a remote location, you must be signed on through a GW VPN profile so that you are on the GW network.
b. Once you are on the GW network, open an internet browser and log into: Power BI Cube Reports.
c. You will see the following log in page:
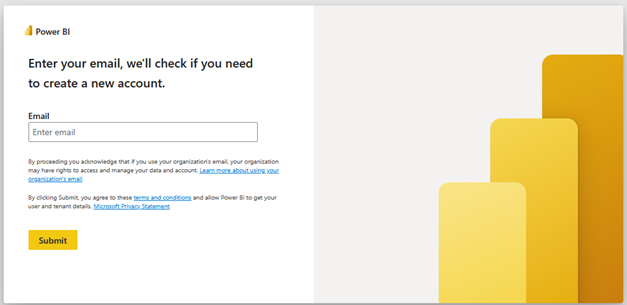
d. Your gwu.edu email address should be entered and then “Submit” should be selected.
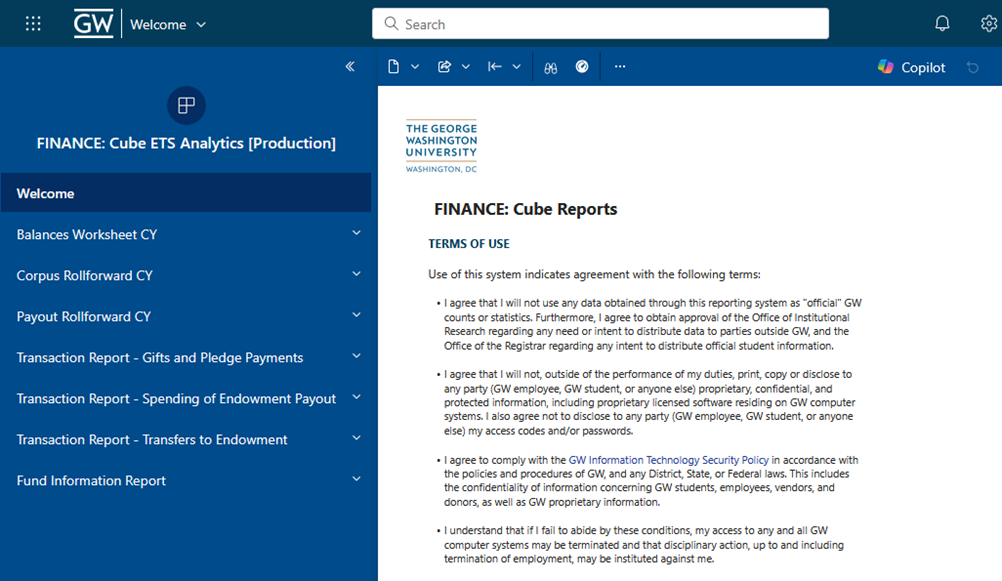
e. Once you are logged in you will see the Finance: Cube Reports main log in page:
2. Reports
The Reports within ETS Cube Power BI are:
- Balances Worksheet CY
- Corpus Rollforward CY
a. Corpus Rollforward FY-1 - Payout Rollforward CY
a. Payout Rollforward FY-1 - Transaction Report - Gifts and Pledge Payments
- Transaction Report - Spending of Endowment Payout
- Transaction Report - Transfers to Endowment
- Fund Information Report
2a. Report Content:
- Balances Worksheet – Current Year
a. Units
b. Book Value
c. Market Value
d. Unspent Payout
- Corpus Rollforward – Current Year and Corpus Rollforward – Prior Fiscal Year
a. Corpus Beginning Balance
b. Gifts and Pledge Payments FYTD
c. Transfers to Endowment Fund FYTD
d. Reinvestment Endowment Payout FYTD
e. Corpus Ending Balance
f. Units
- Payout Rollforward – Current Year and Payout Rollforward – Prior Fiscal Year
a. Unspent Payout Beginning Balance
b. Market Value Allocated to Payout FYTD
c. Spending Transfers FYTD
d. Spending – Direct Payments FYTD
e. Reinvested Endowment Payout FYTD
f. Release of Restrictions FYTD
g. Adjustments to Unspent Payout FYTD
h. Accumulated Unspent Payout Current Month
i. Payout to be Allocated Remainder of FY
j. Projected Payout at End of FY
k. Units
Note: The Current Year version of each worksheet/rollforward will include partial year data / data as of the most recent month end, whereas the Prior Year version of each rollforward will include full year data / data as of the prior fiscal year end.
- Transaction Report – includes transaction‐level details of:
a. Gifts and Pledge Payments
b. Transfers to Endowment
c. Spending of Endowment Payout
- Fund Information
a. Fund Number
b. Fund Name
c. Designated Purpose
d. Type
e. Payout Threshold – Indicates payout is automatically reinvested monthly
f. Reinvest Payout (Yes/No) – Indicates whether unused payout will be automatically reinvested at fiscal year end
g. Grouper Code
h. Subgrouper Code – Not used for all funds, so may show as blank
Note: The data contained in the Fund Information report is on a real time basis and is not limited to the prior month end date like the rollforwards and worksheets.
2b. Report Refresh Timing:
Current Year Data: The worksheet, rollforward, and transaction reports current year data will be refreshed on or around the 6th business day after each month end to include the prior month’s cumulative FYTD information. For example, November data/transactions will be available for review on or around the 6th business day of December in Power BI.
Prior year data: The Prior Year version of each rollforward will include full year data / data as of the prior fiscal year end.
Note: The worksheet, rollforward, and transaction reports will be refreshed with June through September data once the annual audit is complete (generally in early October). See the monthly schedule.
2c. Report Navigation:
- Balance Worksheet Current Year:
a. In the navigation window pane on the left, select “Balance Worksheet CY”:

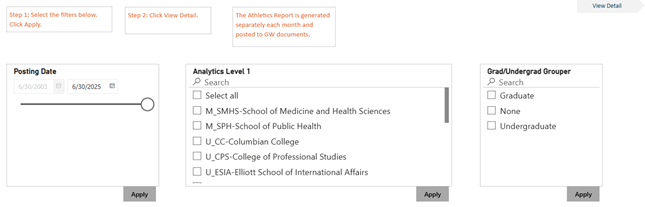
b. Apply your filter by Posting Date
c. Apply your filter by Analytics Level
d. Then, select “Apply” for filters to be updated
Note: If a special report (Grad/Undergrad Grouper) is to be run then the “Analytics Level 1” filter should be left unselected
e. Once the filters have been applied select “View Detail” on top right-hand corner:
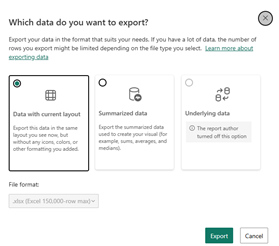
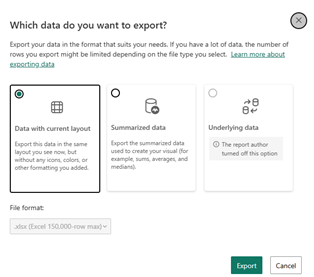
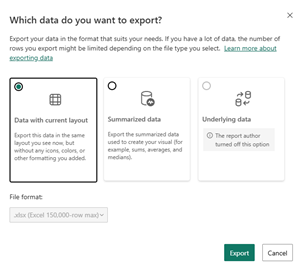
f. To export the data, once in the detailed view, hover over the 3 dots (…) on the top right-hand corner and select “Export data”:
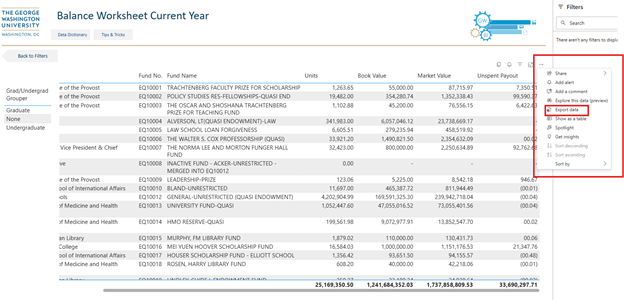
g. Select “Export” to download the data in excel
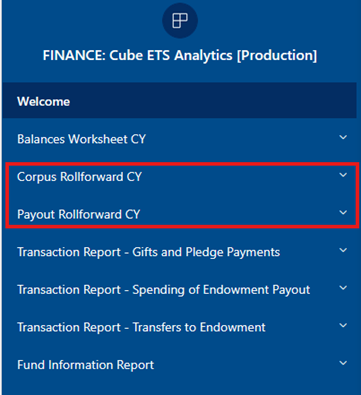
- Corpus Rollforward CY and Payout Rollforward CY:
a. In the navigation window pane on the left, select “Corpus Rollforward CY” or “Payout Rollforward CY:
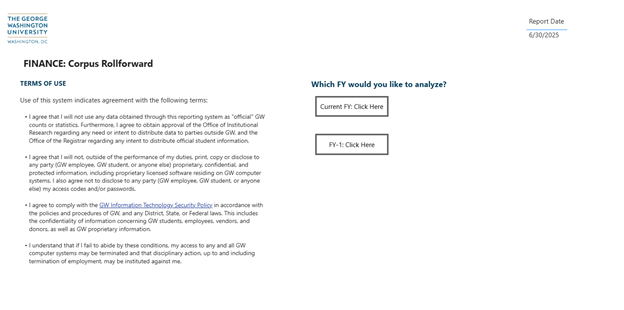
b. Once selected, you will need to select “Current FY: Click Here” for current fiscal year data, or “FY-1: Click Here” for the full prior year fiscal data as of June:
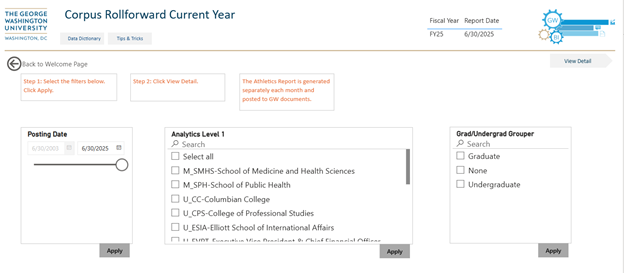
c. Apply your filter by Posting Date (note if the “FY-1” rollforward was selected the posting date filter will not appear, as it is automatically set to pull the full prior fiscal year data as of June)
d. Apply your filter by Analytics Level
e. Then, select “Apply” for filters to be updated
Note 1: Corpus Rollforward CY/FY-1: If a special report (Grad/Undergrad Grouper) is to be run then the “Analytics Level 1” filter should be left unselected.
Note 2: Payout Rollforward CY/FY-1: If a special report (Grad/Undergrad Grouper) is to be run, the desired "Grad/Undergrad" filter must first be selected and the filter must be “applied”, then the desired “Analytics Level 1” filter must be secondarily selected. If the full special report (Grad/Undergrad) is desired, then all of the “Analytics Level 1” filters that populate after the desired "Grad/Undergrad" filter has been applied must be selected.
f. Once the filters have been applied select “View Detail” on top right-hand corner:
g. To export the data, once in the detailed view, hover over the 3 dots (…) on the top right-hand corner and select “Export data”:
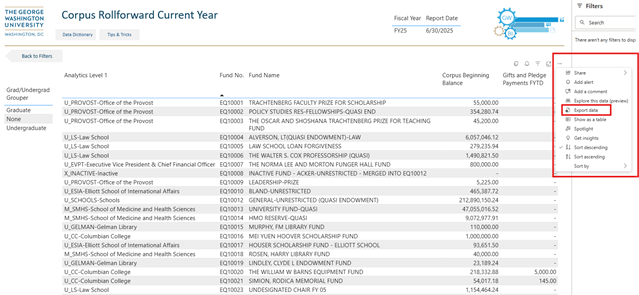
h. Select “Export” to download the data in excel:
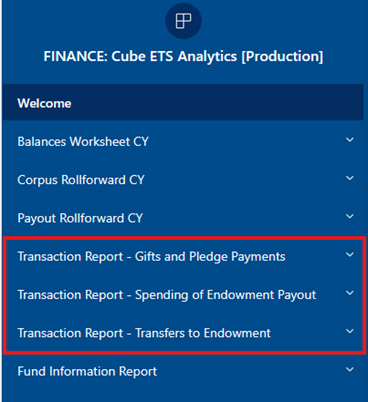
- Transaction Report:
a. In the navigation window pane on the left, select:
- Transaction Report – Gifts and Pledge Payments
- Transaction Report – Spending of Endowment Payout
- Transaction Report – Transfers to Endowment
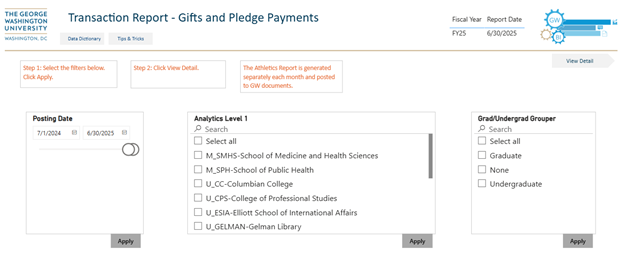
b. Apply your filter by Posting Date
c. Apply your filter by Analytics Level
d. Then, select “Apply” for filters to be updated
Note: If a special report (Grad/Undergrad Grouper) is to be run then the “Analytics Level 1” filter should be left unselected
e. Once the filters have been applied select “View Detail” on top right-hand corner:
f. To export the data, once in the detailed view, hover over the 3 dots (…) on the top right-hand corner and select “Export data”:
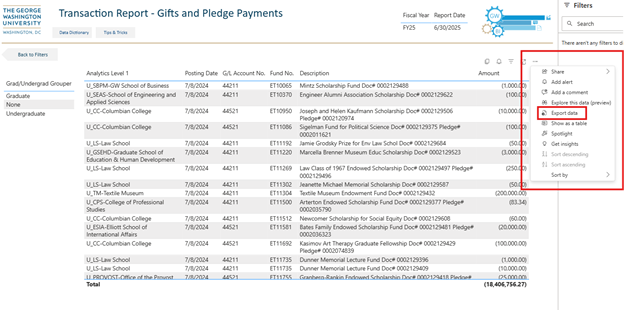
g. Select “Export” to download the data in excel:

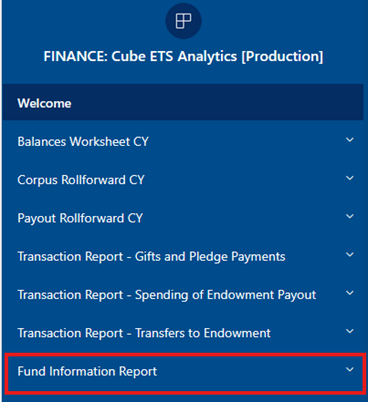
- Fund Information Report:
a. In the navigation window pane on the left, select “Fund Information Report”:
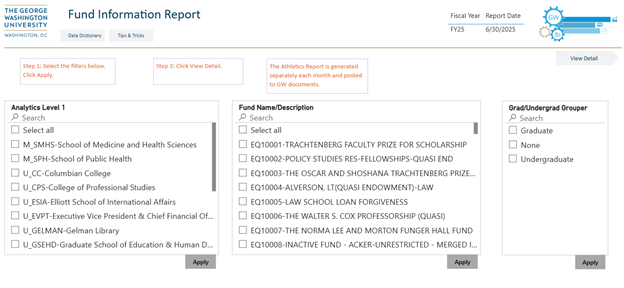
b. Apply your filter by Analytics Level or by Fund Level
c. Then, select “Apply” for filters to be updated
Note: If a special report (Grad/Undergrad Grouper) is to be run then the “Analytics Level 1” filter should be left unselected
d. Once the filters have been applied select “View Detail” on top right-hand corner:
e. To export the data, once in the detailed view, hover over the 3 dots (…) on the top right-hand corner and select “Export data”:
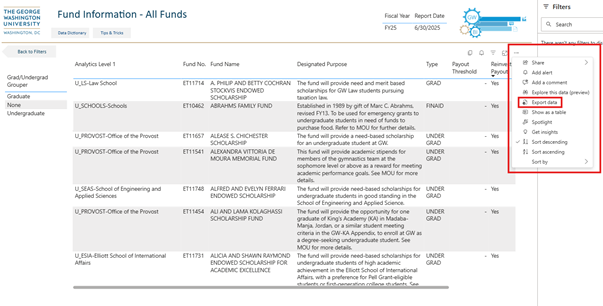
f. Select “Export” to download the data in excel:
3. General Information
- Athletics Reports
a. Athletic Reports will be separately generated outside of Power BI on a monthly basis and will be filed in GW documents. - Power BI Endowment Data Load Timing
a. When logging in for the first time it may take 2-3 minutes for the data to load in ETS Cube Power BI. - Resetting Filters
a. If all filters need to be reset to their default setting, the following icon may be selected within the data filter page:

b. Then “Reset” below should be selected:
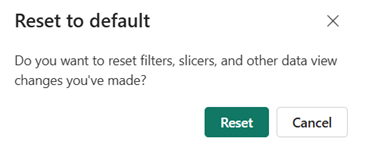
c. By selecting this option, the filters selected will automatically reset to their default setting.
- New Users
a. If a new user needs to access endowment data via the ETS Cube Power BI, a GW Help Desk Ticket should be submitted at: https://it.gwu.edu/support-ticket.